Kroki
- Tier: Free, Premium, Ultimate
- Offering: GitLab Self-Managed, GitLab Dedicated
通过 Kroki 集成,您可以在 AsciiDoc、Markdown、reStructuredText 和 Textile 中创建图表即代码 (diagrams-as-code)。
在 GitLab 中启用 Kroki
您需要在 管理员 区域下的“设置”中启用 Kroki 集成。 为此,请使用管理员帐户登录,然后按以下步骤操作:
- 在左侧边栏的底部,选择 管理员。
- 转到 设置 > 通用。
- 展开 Kroki 部分。
- 选中 启用 Kroki 复选框。
- 输入 Kroki URL,例如
https://kroki.io。
Kroki 服务器
启用 Kroki 后,GitLab 会将图表发送到 Kroki 实例以将其显示为图像。
您可以使用免费的公共云实例 https://kroki.io,也可以在您自己的基础设施上 安装 Kroki。
安装 Kroki 后,请务必更新设置中的 Kroki URL 以指向您的实例。
Kroki 图表不存储在 GitLab 上,因此标准的 GitLab 访问控制和其他用户权限限制不生效。
Docker
使用 Docker,像这样运行容器:
docker run -d --name kroki -p 8080:8000 yuzutech/krokiKroki URL 是运行容器的服务器的主机名。
yuzutech/kroki Docker 镜像开箱即用地支持大多数图表类型。有关完整列表,请参阅 Kroki 安装文档。
支持的图表类型包括:
- Bytefield
- D2
- DBML
- Ditaa
- Erd
- GraphViz
- Nomnoml
- PlantUML
- C4 model (with PlantUML)
- Structurizr (great for C4 Model diagrams)
- Svgbob
- UMlet
- Vega
- Vega-Lite
- WaveDrom
如果您想使用其他图表库,请阅读 Kroki 安装指南 以了解如何启动 Kroki 伴随容器。
创建图表
启用并配置 Kroki 集成后,您就可以开始使用分隔块向 AsciiDoc 或 Markdown 文档中添加图表:
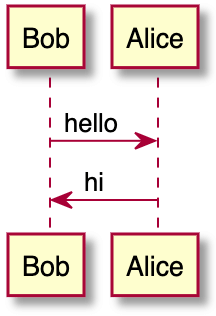
-
Markdown
```plantuml Bob -> Alice : hello Alice -> Bob : hi ``` -
AsciiDoc
[plantuml] .... Bob->Alice : hello Alice -> Bob : hi .... -
reStructuredText
.. code-block:: plantuml Bob->Alice : hello Alice -> Bob : hi -
Textile
bc[plantuml]. Bob->Alice : hello
Alice -> Bob : hi
这些分隔块会被转换为 HTML 图像标签,其源指向 Kroki 实例。如果 Kroki 服务器配置正确,这应该会渲染出一个漂亮的图表,而不是显示代码块:
Kroki 支持十多种图表库。以下是一些 AsciiDoc 的示例:
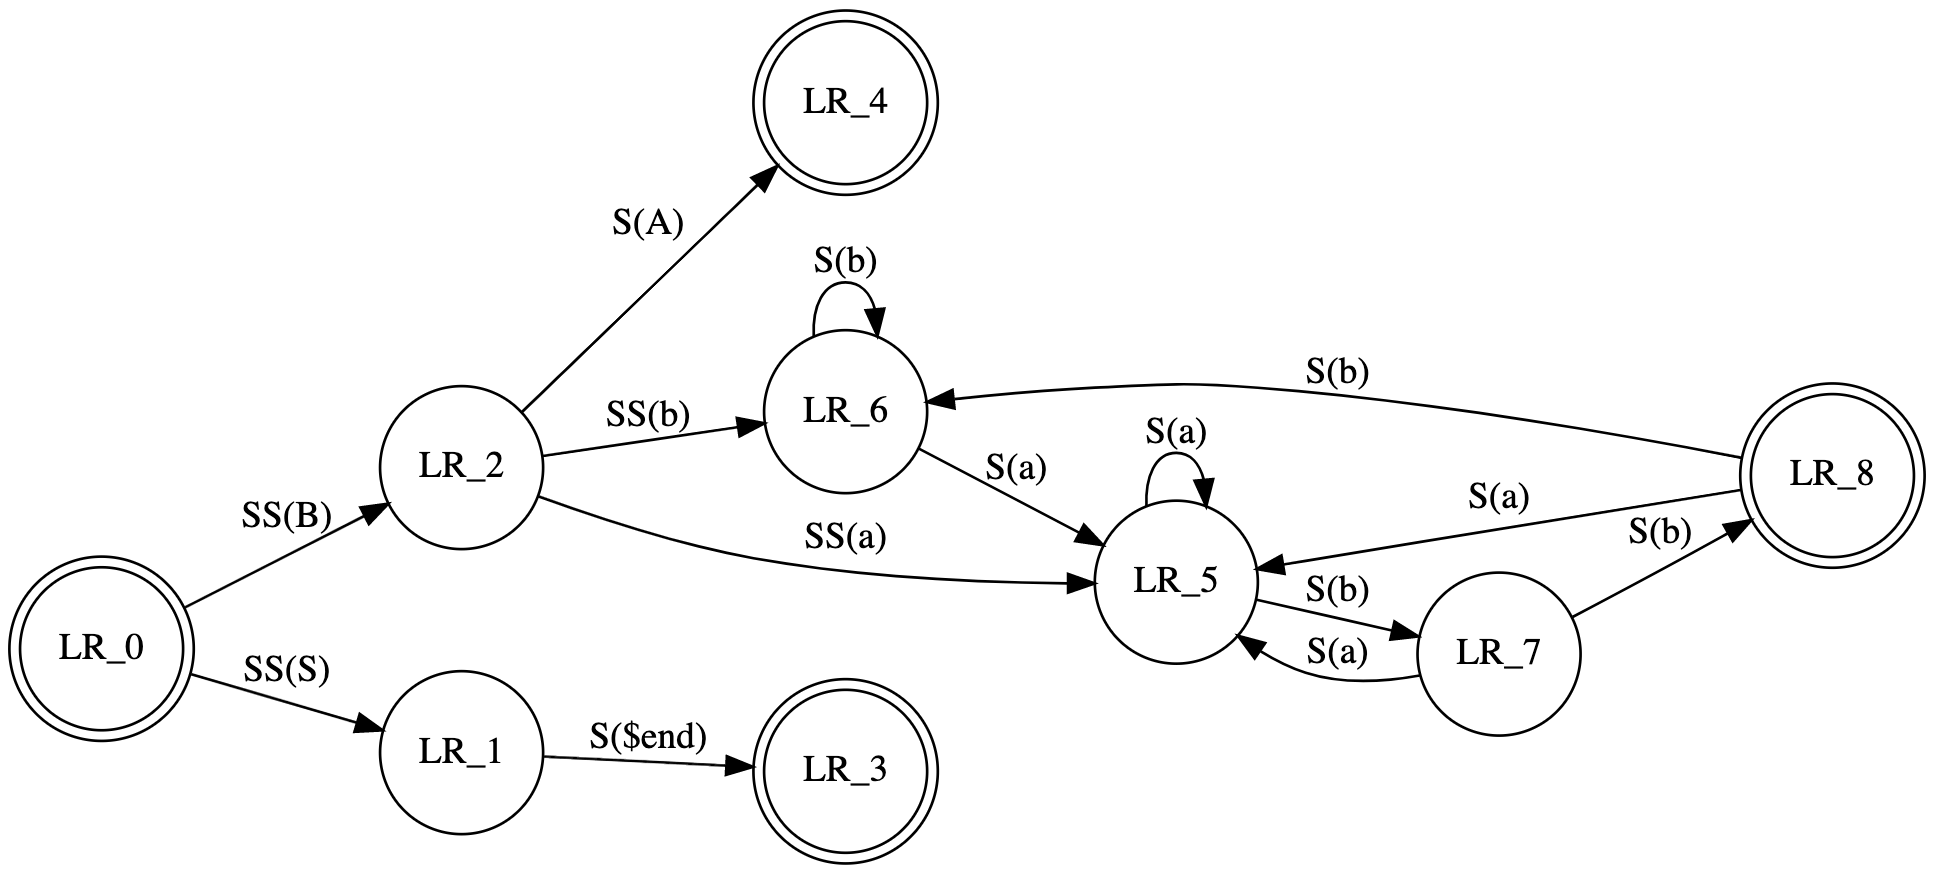
GraphViz
[graphviz]
....
digraph finite_state_machine {
  rankdir=LR;
  node [shape = doublecircle]; LR_0 LR_3 LR_4 LR_8;
  node [shape = circle];
  LR_0 -> LR_2 [ label = "SS(B)" ];
  LR_0 -> LR_1 [ label = "SS(S)" ];
  LR_1 -> LR_3 [ label = "S($end)" ];
  LR_2 -> LR_6 [ label = "SS(b)" ];
  LR_2 -> LR_5 [ label = "SS(a)" ];
  LR_2 -> LR_4 [ label = "S(A)" ];
  LR_5 -> LR_7 [ label = "S(b)" ];
  LR_5 -> LR_5 [ label = "S(a)" ];
  LR_6 -> LR_6 [ label = "S(b)" ];
  LR_6 -> LR_5 [ label = "S(a)" ];
  LR_7 -> LR_8 [ label = "S(b)" ];
  LR_7 -> LR_5 [ label = "S(a)" ];
  LR_8 -> LR_6 [ label = "S(b)" ];
  LR_8 -> LR_5 [ label = "S(a)" ];
}
....
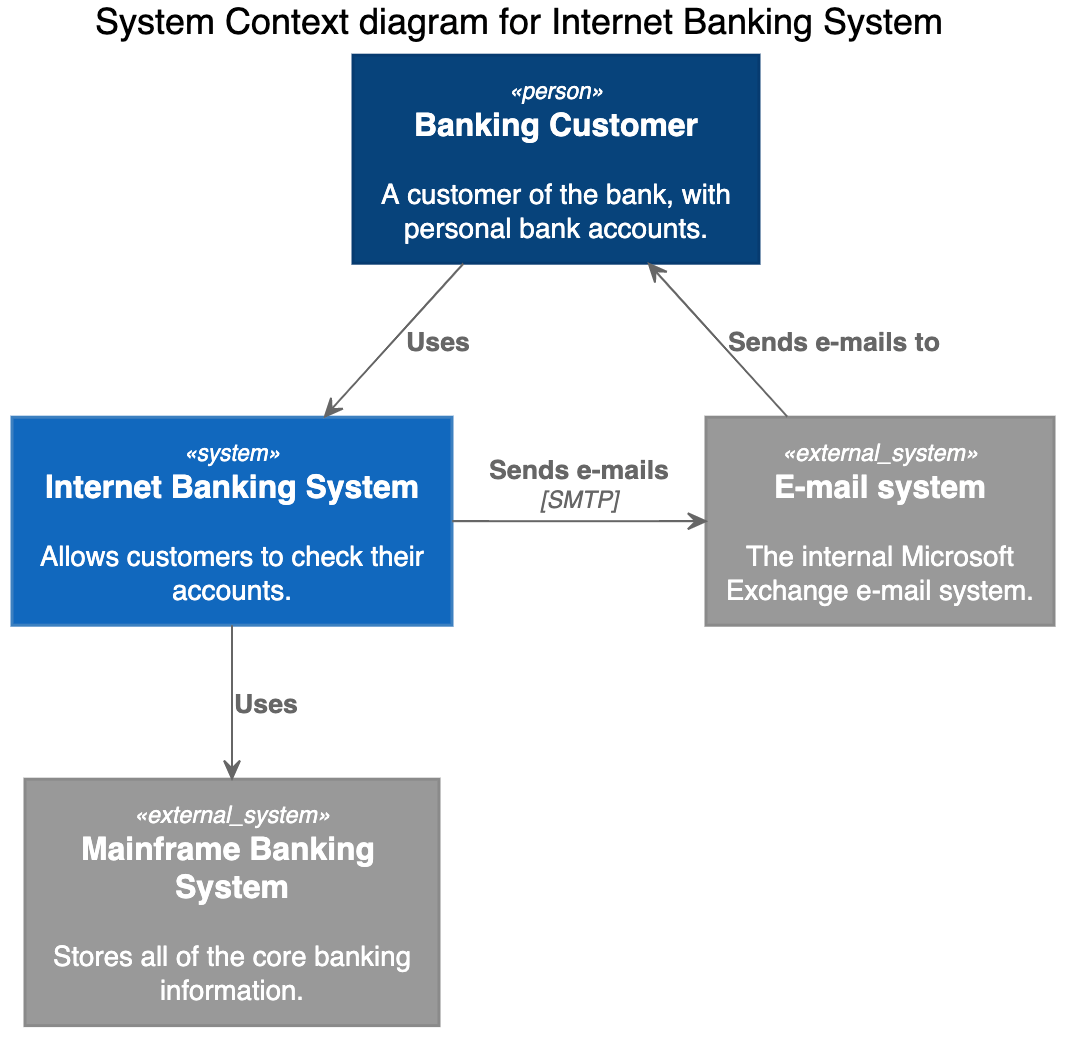
C4 (基于 PlantUML)
[c4plantuml]
....
@startuml
!include C4_Context.puml

title System Context diagram for Internet Banking System

Person(customer, "Banking Customer", "A customer of the bank, with personal bank accounts.")
System(banking_system, "Internet Banking System", "Allows customers to check their accounts.")

System_Ext(mail_system, "E-mail system", "The internal Microsoft Exchange e-mail system.")
System_Ext(mainframe, "Mainframe Banking System", "Stores all of the core banking information.")

Rel(customer, banking_system, "Uses")
Rel_Back(customer, mail_system, "Sends e-mails to")
Rel_Neighbor(banking_system, mail_system, "Sends e-mails", "SMTP")
Rel(banking_system, mainframe, "Uses")
@enduml
....
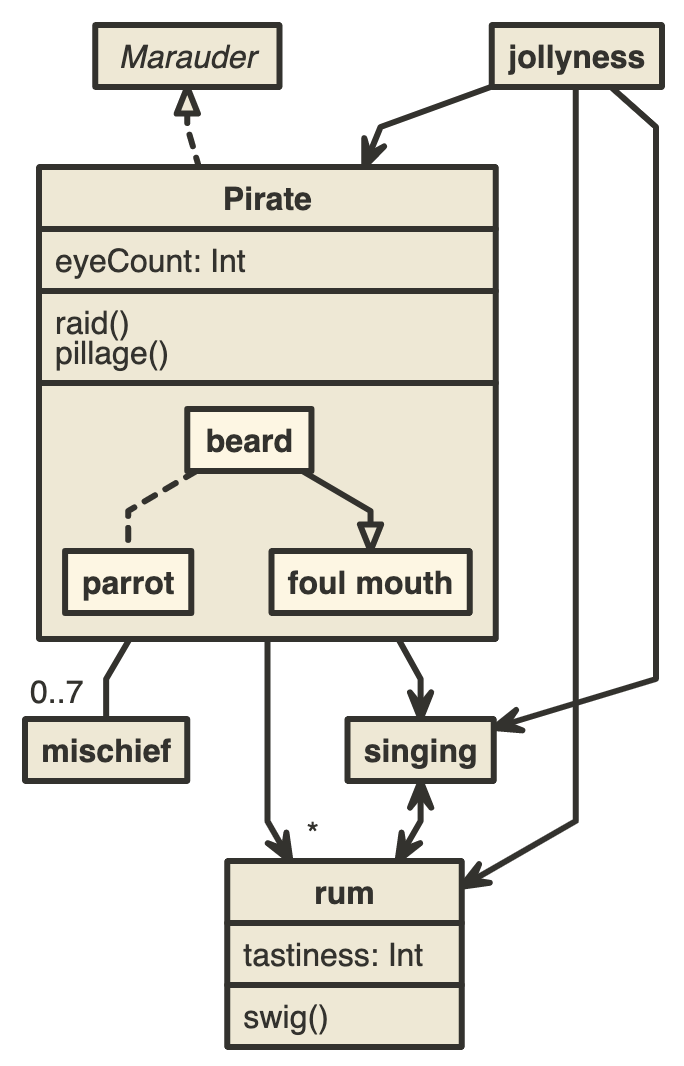
Nomnoml
[nomnoml]
....
[Pirate|eyeCount: Int|raid();pillage()|
  [beard]--[parrot]
  [beard]-:>[foul mouth]
]

[<abstract>Marauder]<:--[Pirate]
[Pirate]- 0..7[mischief]
[jollyness]->[Pirate]
[jollyness]->[rum]
[jollyness]->[singing]
[Pirate]-> *[rum|tastiness: Int|swig()]
[Pirate]->[singing]
[singing]<->[rum]
....