---
stage: none
group: unassigned
info: 任何拥有 Maintainer 角色的用户均可合并对此内容的更新。详情请参见 https://docs.gitlab.com/development/development_processes/#development-guidelines-review.
title: 性能分析
---

为便于追踪性能问题,GitLab 提供了一系列性能分析工具,其中部分默认可用,部分需手动启用。

## 分析 URL

`Gitlab::Profiler.profile` 方法及对应的 `bin/profile-url` 脚本,支持对特定 URL 的 GET 或 POST 请求进行分析(默认以匿名用户身份,或指定用户身份)。

分析器的第一个参数需为完整 URL(包含实例主机名)或绝对路径(需包含前导斜杠)。

默认情况下,报告转储将存储在临时文件中,可通过 [Stackprof API](#reading-a-gitlabprofiler-report) 交互使用。

使用脚本时,可通过无参数调用查看命令行文档。

在交互式控制台会话中使用该方法时,会话内应用代码的变更会实时反映在分析器输出中。

例如:

```ruby
Gitlab::Profiler.profile('/my-user')
# 返回报告转储存储的临时文件位置
class UsersController; def show; sleep 100; end; end
Gitlab::Profiler.profile('/my-user')
# 返回报告转储存储的临时文件位置
# 其中 100 秒时间消耗在 UsersController#show 中
对于需要授权的路由,必须向 Gitlab::Profiler 提供用户,例如:
Gitlab::Profiler.profile('/gitlab-org/gitlab-test', user: User.first)向 Gitlab::Profiler.profile 传入 logger: 关键字参数,可将 ActiveRecord 和 ActionController 日志输出到指定日志器。更多选项请参考方法源码文档。
Gitlab::Profiler.profile('/gitlab-org/gitlab-test', user: User.first, logger: Logger.new($stdout))传入 profiler_options 哈希配置采样数据的输出文件(out),例如:
Gitlab::Profiler.profile('/gitlab-org/gitlab-test', user: User.first, profiler_options: { out: 'tmp/profile.dump' })读取 GitLab::Profiler 报告
对采样数据运行 Stackprof 可获取时间消耗摘要。例如:
stackprof tmp/profile.dump示例采样数据:
==================================
  Mode: wall(1000)
  Samples: 8745 (6.92% miss rate)
  GC: 1399 (16.00%)
==================================
     TOTAL    (pct)     SAMPLES    (pct)     FRAME
      1022  (11.7%)        1022  (11.7%)     Sprockets::PathUtils#stat
       957  (10.9%)         957  (10.9%)     (marking)
       493   (5.6%)         493   (5.6%)     Sprockets::PathUtils#entries
       576   (6.6%)         471   (5.4%)     Mustermann::AST::Translator#decorator_for
       439   (5.0%)         439   (5.0%)     (sweeping)
       630   (7.2%)         241   (2.8%)     Sprockets::Cache::FileStore#get
       208   (2.4%)         208   (2.4%)     ActiveSupport::FileUpdateChecker#watched
       206   (2.4%)         206   (2.4%)     Digest::Instance#file
       544   (6.2%)         176   (2.0%)     Sprockets::Cache::FileStore#safe_open
       176   (2.0%)         176   (2.0%)     ActiveSupport::FileUpdateChecker#max_mtime
       268   (3.1%)         147   (1.7%)     ActiveRecord::ConnectionAdapters::PostgreSQLAdapter#exec_no_cache
       140   (1.6%)         140   (1.6%)     ActiveSupport::BacktraceCleaner#add_gem_filter
       116   (1.3%)         116   (1.3%)     Bootsnap::CompileCache::ISeq.storage_to_output
       160   (1.8%)         113   (1.3%)     Gem::Version#<=>
       109   (1.2%)         109   (1.2%)     block in <main>
       108   (1.2%)         108   (1.2%)     Gem::Version.new
       131   (1.5%)         105   (1.2%)     Sprockets::EncodingUtils#unmarshaled_deflated
      1166  (13.3%)          82   (0.9%)     Mustermann::RegexpBased#initialize
        82   (0.9%)          78   (0.9%)     FileUtils.touch
        72   (0.8%)          72   (0.8%)     Sprockets::Manifest.compile_match_filter
        71   (0.8%)          70   (0.8%)     Grape::Router#compile!
        91   (1.0%)          65   (0.7%)     ActiveRecord::ConnectionAdapters::PostgreSQL::DatabaseStatements#query
        93   (1.1%)          64   (0.7%)     ActionDispatch::Journey::Path::Pattern::AnchoredRegexp#accept
        59   (0.7%)          59   (0.7%)     Mustermann::AST::Translator.dispatch_table
        62   (0.7%)          59   (0.7%)     Rails::BacktraceCleaner#initialize
      2492  (28.5%)          49   (0.6%)     Sprockets::PathUtils#stat_directory
       242   (2.8%)          49   (0.6%)     Gitlab::Instrumentation::RedisBase.add_call_details
        47   (0.5%)          47   (0.5%)     URI::RFC2396_Parser#escape
        46   (0.5%)          46   (0.5%)     #<Class:0x00000001090c2e70>#__setobj__
        44   (0.5%)          44   (0.5%)     Sprockets::Base#normalize_logical_path
也可生成火焰图:
stackprof --d3-flamegraph tmp/profile.dump > flamegraph.html更多详情请参阅 Stackprof 文档。
Speedscope 火焰图
通过性能栏中的火焰图采样模式按钮,或在请求中添加 performance_bar=flamegraph 参数,可为特定 URL 生成火焰图。
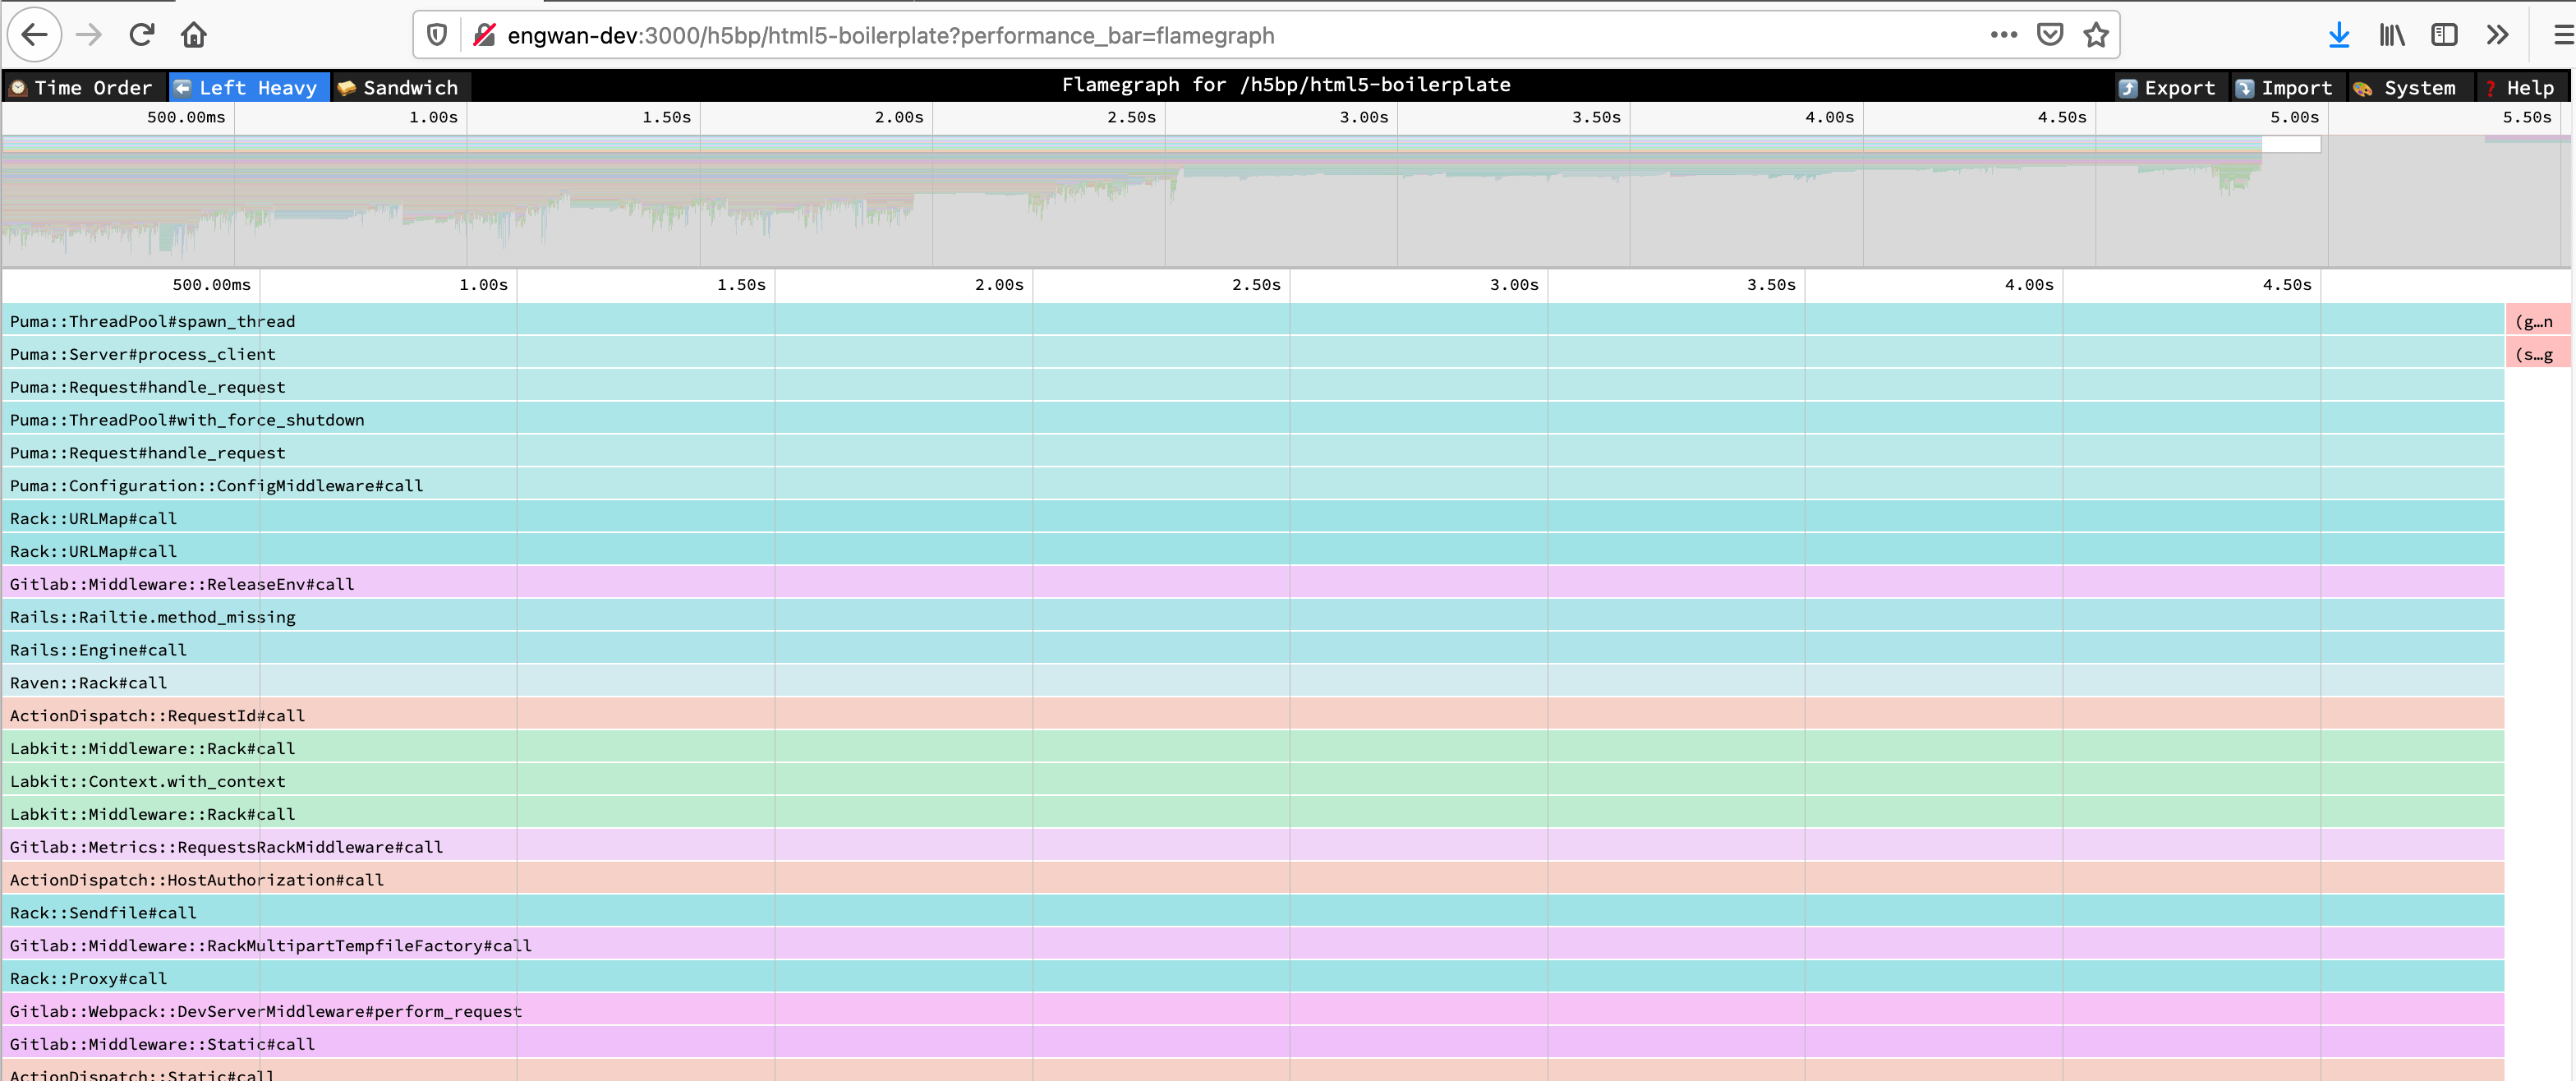
关于视图的更多信息请参见 Speedscope 文档。
不同采样模式的详情请参见 Stackprof 文档。
此功能对可访问性能栏的所有用户启用。
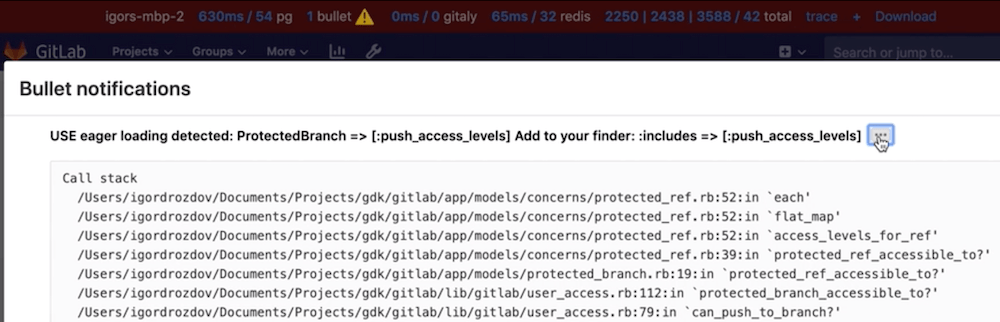
Bullet
Bullet 是一个用于追踪 N+1 查询问题的 Gem。它将查询问题记录到 Rails 日志和浏览器控制台。Bullet 部分显示在 性能栏 中。
Bullet 默认仅在开发模式启用,但日志功能默认关闭(因其日志噪音较大)。配置 Bullet 及其日志:
-
在环境中手动启用/禁用 Bullet,在
config/gitlab.yml中添加以下行(根据需要修改enabled值):bullet: enabled: false -
启用 Bullet 日志,启动 GitLab 前设置
ENABLE_BULLET环境变量为非空值:ENABLE_BULLET=true bundle exec rails s
使用 Bullet 发现 N+1 查询后,建议编写 QueryRecorder 测试 防止回归。
系统统计信息
在分析期间或之后,您可能需要获取 Ruby 虚拟机进程的详细信息,例如内存消耗、CPU 时间或垃圾回收器统计。这些信息可通过各种工具单独获取,为方便起见,我们添加了汇总端点以 JSON 格式导出数据:
curl localhost:3000/-/metrics/system | jq示例输出:
{
  "version": "ruby 2.7.2p137 (2020-10-01 revision a8323b79eb) [x86_64-linux-gnu]",
  "gc_stat": {
    "count": 118,
    "heap_allocated_pages": 11503,
    "heap_sorted_length": 11503,
    "heap_allocatable_pages": 0,
    "heap_available_slots": 4688580,
    "heap_live_slots": 3451712,
    "heap_free_slots": 1236868,
    "heap_final_slots": 0,
    "heap_marked_slots": 3451450,
    "heap_eden_pages": 11503,
    "heap_tomb_pages": 0,
    "total_allocated_pages": 11503,
    "total_freed_pages": 0,
    "total_allocated_objects": 32679478,
    "total_freed_objects": 29227766,
    "malloc_increase_bytes": 84760,
    "malloc_increase_bytes_limit": 32883343,
    "minor_gc_count": 88,
    "major_gc_count": 30,
    "compact_count": 0,
    "remembered_wb_unprotected_objects": 114228,
    "remembered_wb_unprotected_objects_limit": 228456,
    "old_objects": 3185330,
    "old_objects_limit": 6370660,
    "oldmalloc_increase_bytes": 21838024,
    "oldmalloc_increase_bytes_limit": 119181499
  },
  "memory_rss": 1326501888,
  "memory_uss": 1048563712,
  "memory_pss": 1139554304,
  "time_cputime": 82.885264633,
  "time_realtime": 1610459445.5579069,
  "time_monotonic": 24001.23145713,
  "worker_id": "puma_0"
}
此端点仅对 Rails Web Worker 可用。Sidekiq Worker 无法通过此方式检查。
影响性能的设置
应用设置
development环境默认启用热重载,Rails 会在每次请求时检查文件变更,因热重载是单线程的,可能产生潜在竞争锁。development环境可在请求触发后延迟加载代码,导致首次请求始终较慢。
为在性能分析/基准测试中禁用这些功能,启动 GitLab 前设置 RAILS_PROFILE 环境变量为 true。例如使用 GDK 时:
- 在 GDK 根目录创建
env.runit文件 - 在
env.runit文件中添加export RAILS_PROFILE=true - 使用
gdk restart重启 GDK
此环境变量仅适用于开发模式。
GC 设置
Ruby 的垃圾回收器(GC)可通过多种环境变量调优,直接影响应用性能。
下表列出这些变量及其默认值:
| 环境变量 | 默认值 |
|---|---|
RUBY_GC_HEAP_INIT_SLOTS |
10000 |
RUBY_GC_HEAP_FREE_SLOTS |
4096 |
RUBY_GC_HEAP_FREE_SLOTS_MIN_RATIO |
0.20 |
RUBY_GC_HEAP_FREE_SLOTS_GOAL_RATIO |
0.40 |
RUBY_GC_HEAP_FREE_SLOTS_MAX_RATIO |
0.65 |
RUBY_GC_HEAP_GROWTH_FACTOR |
1.8 |
RUBY_GC_HEAP_GROWTH_MAX_SLOTS |
0 (disable) |
RUBY_GC_HEAP_OLDOBJECT_LIMIT_FACTOR |
2.0 |
RUBY_GC_MALLOC_LIMIT(_MIN) |
(16 * 1024 * 1024 /* 16MB */) |
RUBY_GC_MALLOC_LIMIT_MAX |
(32 * 1024 * 1024 /* 32MB */) |
RUBY_GC_MALLOC_LIMIT_GROWTH_FACTOR |
1.4 |
RUBY_GC_OLDMALLOC_LIMIT(_MIN) |
(16 * 1024 * 1024 /* 16MB */) |
RUBY_GC_OLDMALLOC_LIMIT_MAX |
(128 * 1024 * 1024 /* 128MB */) |
RUBY_GC_OLDMALLOC_LIMIT_GROWTH_FACTOR |
1.2 |
(来源)
GitLab 可能会调整这些设置以提升应用性能、降低内存需求或两者兼顾。
运行 scripts/perf/gc/collect_gc_stats.rb 脚本可查看各设置对空闲 GitLab 实例的 GC 性能、内存使用和启动时间的影响。脚本会将 GC 统计和常规时间数据以 CSV 格式输出到标准输出。
性能问题调查示例
Pipeline Authoring 团队解决了 流水线创建性能问题,同时使用了现有分析方法(如 stackprof 火焰图 和 memory_profiler)以及新方法 ruby-prof。
使用 stackprof 火焰图
性能栏 是通过单击获取 stackprof 报告和火焰图的优秀工具:

但该工具仅适用于 GET 请求。
为获取 POST 请求的火焰图,我们在 API 请求中使用 performance_bar=flamegraph 参数。例如分析 合并请求的流水线创建端点。
通常可用以下命令获取 JSON 格式的 stackprof 报告,但用户控制逻辑 Gitlab::PerformanceBar.allowed_for_user?(request.env['warden']&.user) 仅允许通过 Web 界面认证的用户:
# 生产环境无效

curl --request POST \
  --output flamegraph.json \
  --header 'Content-Type: application/json' \
  --header 'PRIVATE-TOKEN: :token' \
  "https://gitlab.example.com/api/v4/projects/:id/merge_requests/:iid/pipelines?performance_bar=flamegraph"
解决方案:复制请求为 curl 命令并在终端执行:
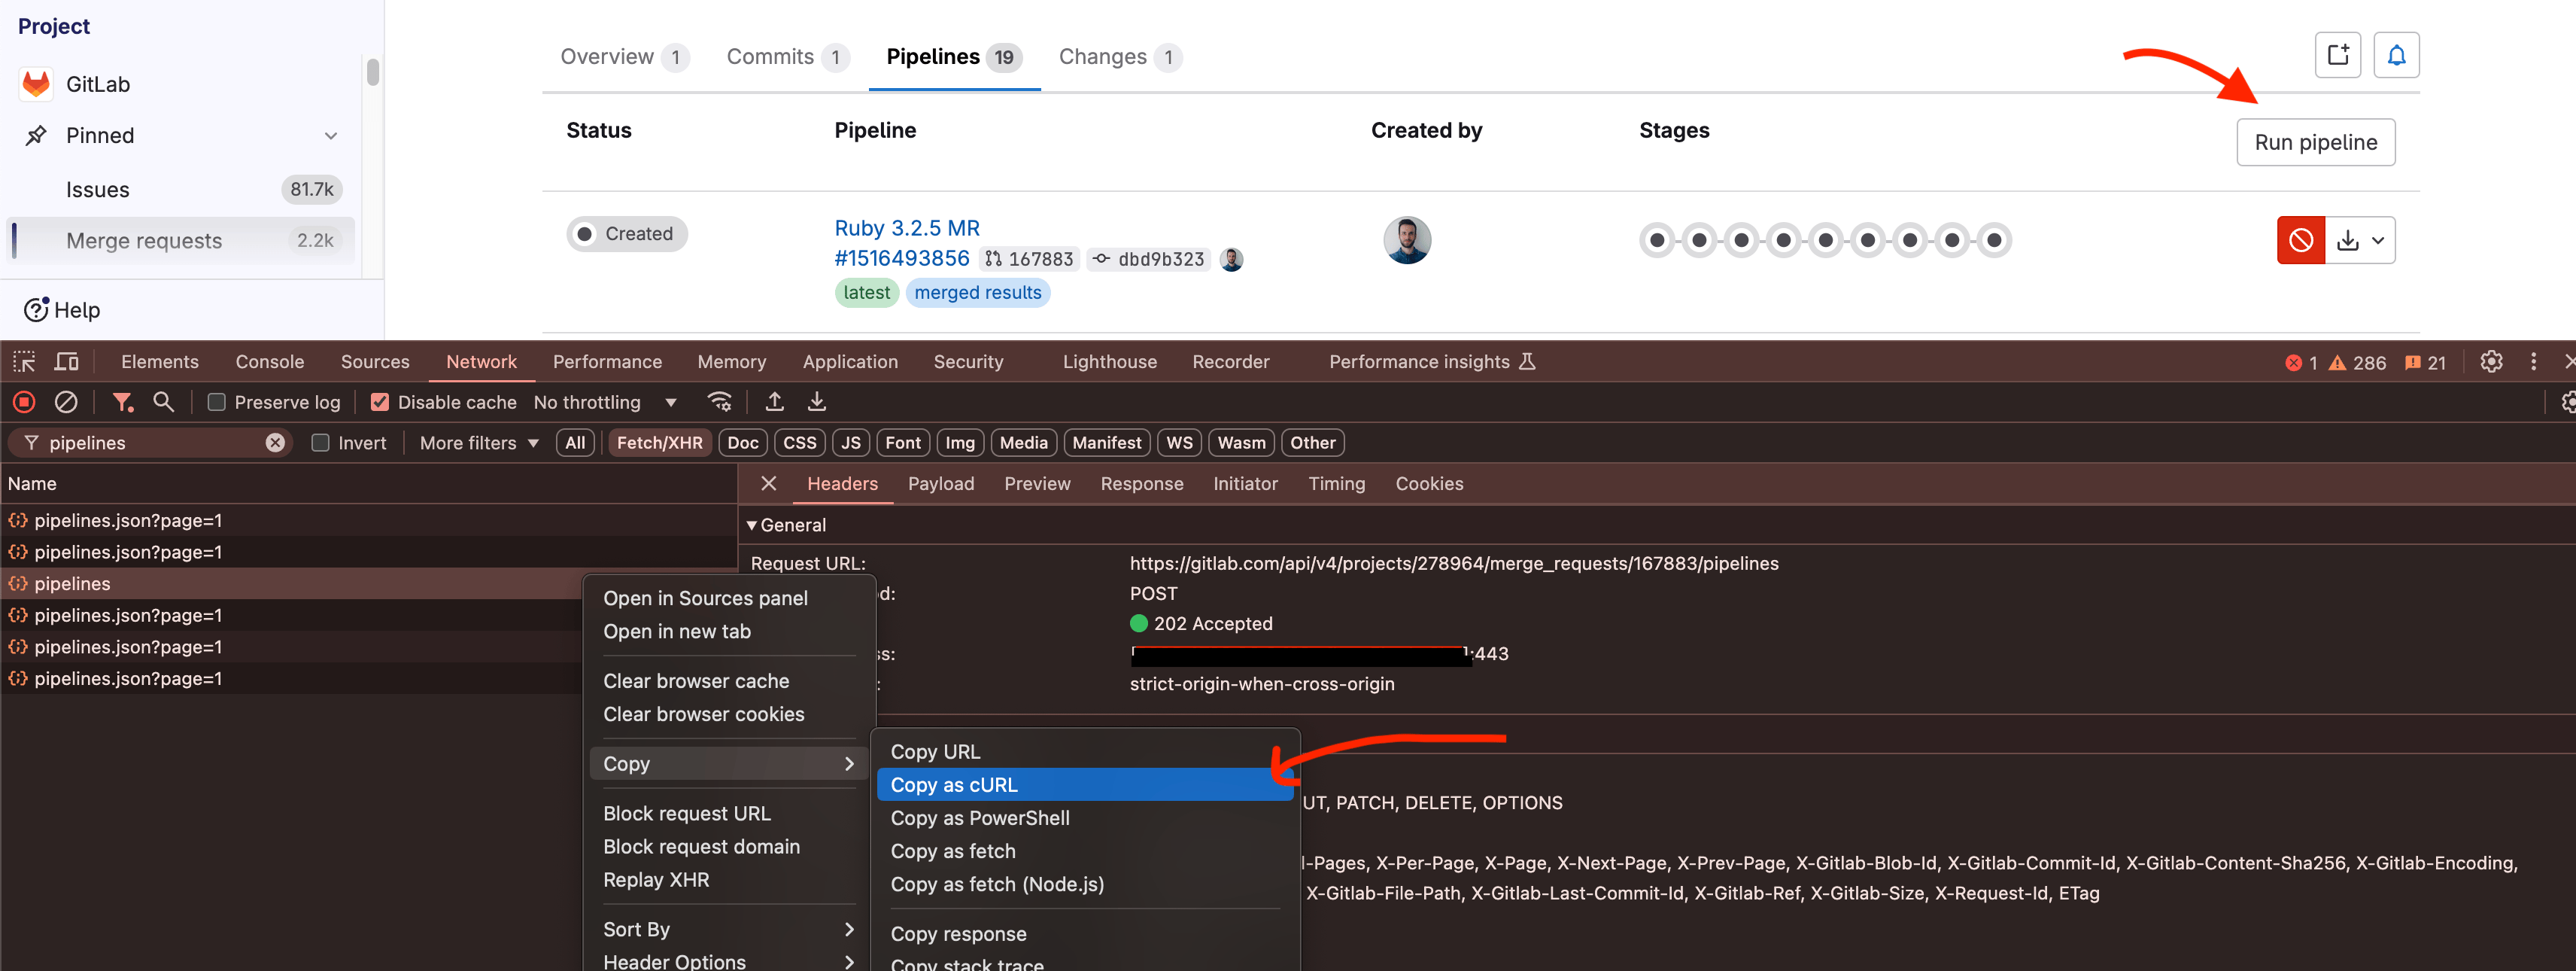
得到类似以下命令:
curl "https://gitlab.com/api/v4/projects/:id/merge_requests/:iid/pipelines" \
  -H 'accept: application/json, text/plain, */*' \
  -H 'content-type: application/json' \
  -H 'cookie: xyz' \
  -H 'x-csrf-token: xyz' \
--data-raw '{"async":true}'- 注意请求体中的
async参数,需移除以获取实际流水线创建性能。 - 需添加
performance_bar=flamegraph参数。 - 需添加
--output flamegraph.json保存 JSON 响应。 - 最后指定仅接受 JSON 响应。
curl "https://gitlab.com/api/v4/projects/:id/merge_requests/:iid/pipelines?performance_bar=flamegraph" \
-X POST \
-o flamegraph.json \
-H 'accept: application/json' \
-H 'content-type: application/json' \
-H 'cookie: xyz' \
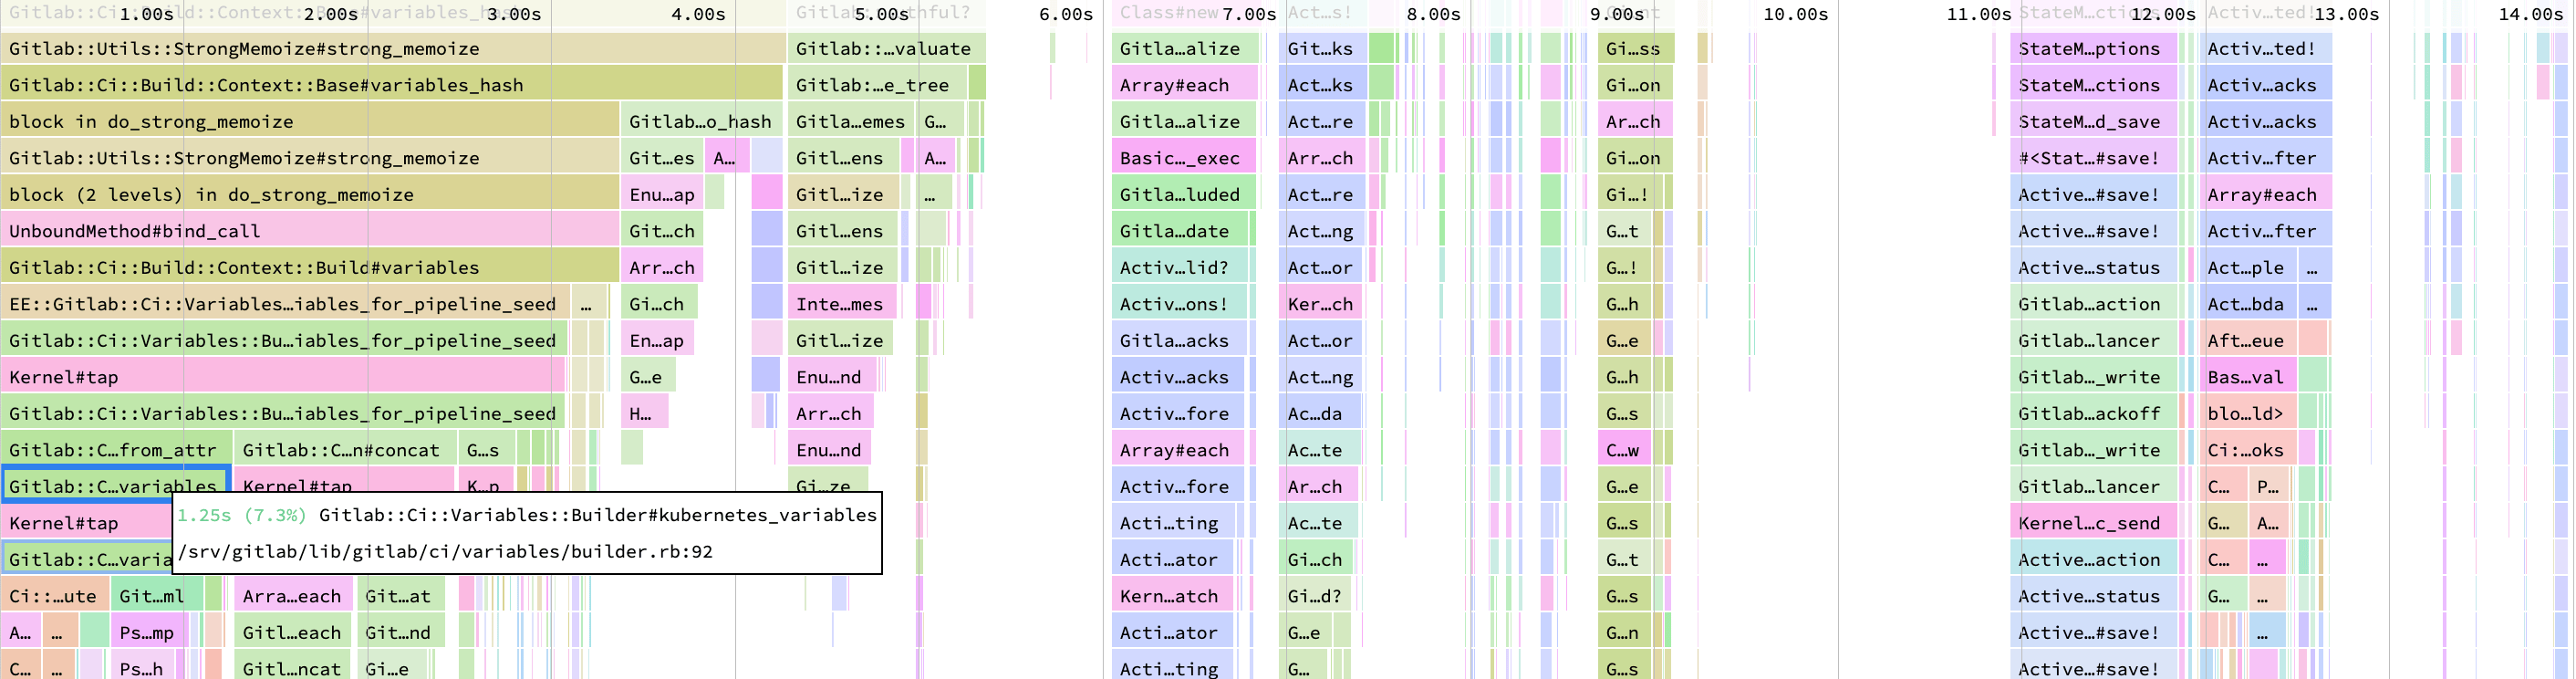
-H 'x-csrf-token: xyz'然后在 https://www.speedscope.app/ 网站使用 flamegraph.json 文件查看火焰图:
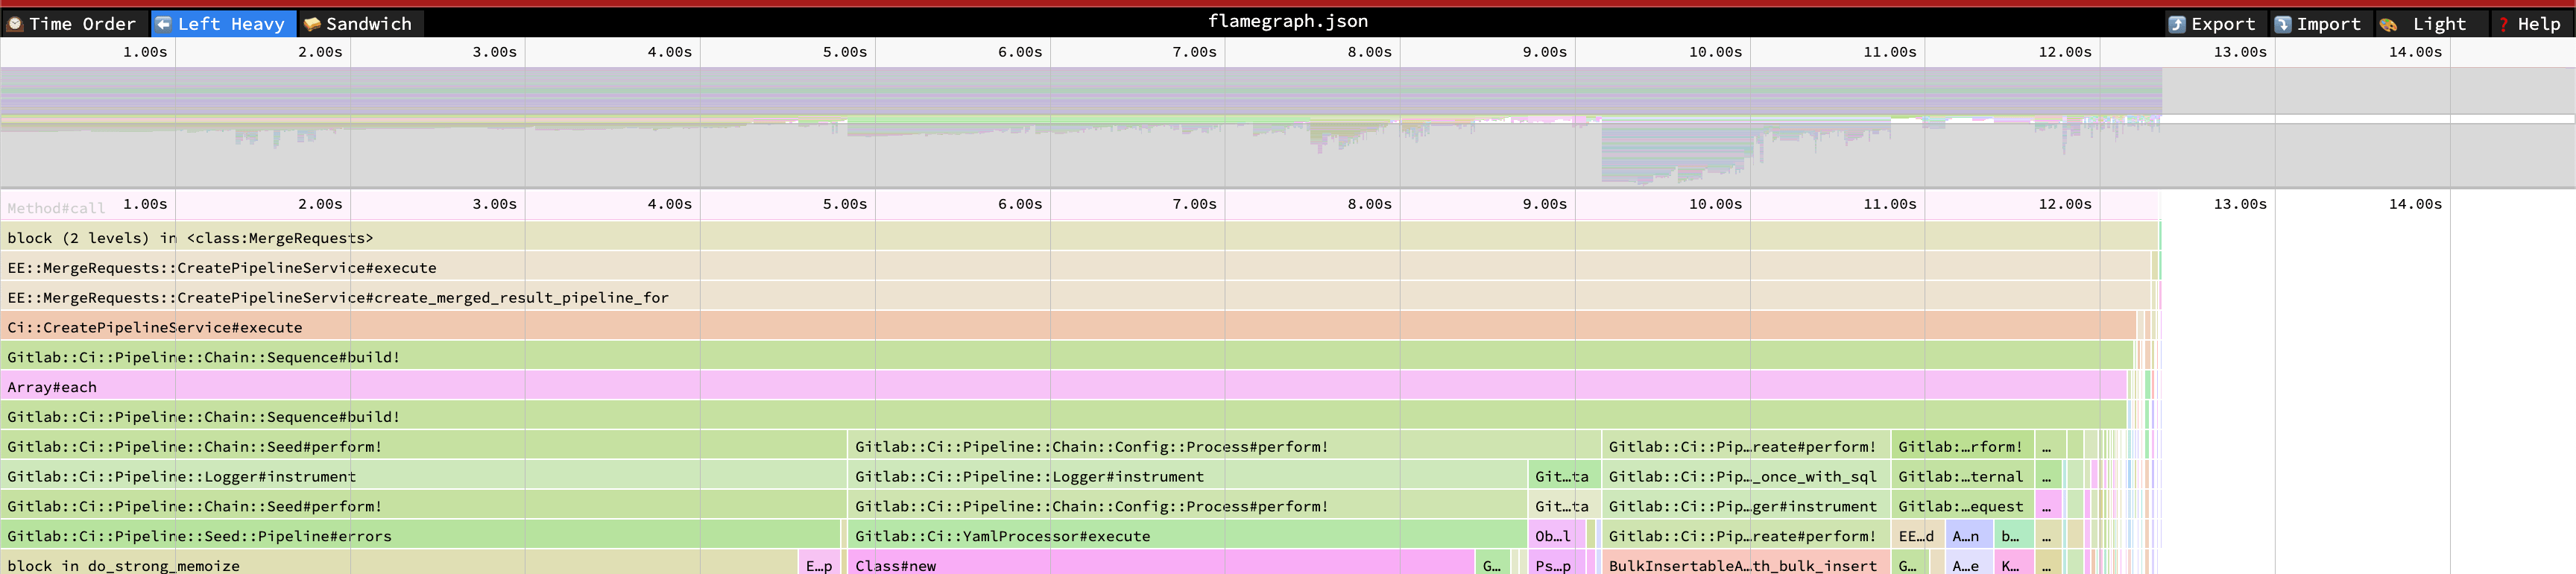
例如分析此火焰图时,发现 kubernetes_variables 方法耗时较长,因此创建了 issue:
使用 ruby-prof
另一种查看时间消耗分布的方法是使用 ruby-prof。它未包含在 Gemfile 中,需先添加到 Gemfile 并运行 bundle install。
调查问题需要副本仓库,可通过将生产仓库镜像到开发环境实现。然后运行 ruby-prof 分析器查看时间消耗:
# RAILS_PROFILE=true GITALY_DISABLE_REQUEST_LIMITS=true rails console

require 'ruby-prof'

ActiveRecord::Base.logger = nil
project = Project.find_by_full_path('root/gitlab-mirror')
user = project.first_owner
merge_request = project.merge_requests.find_by_iid(1)

profile = RubyProf::Profile.new
profile.exclude_common_methods! # 参考 https://github.com/ruby-prof/ruby-prof/blob/1.7.0/lib/ruby-prof/exclude_common_methods.rb

profile.start

Gitlab::SafeRequestStore.ensure_request_store do
  Ci::CreatePipelineService
    .new(project, user, ref: merge_request.source_branch)
    .execute(:merge_request_event, merge_request: merge_request)
    .payload
end; nil

result = profile.stop

callstack_printer = RubyProf::CallStackPrinter.new(result)
File.open('tmp/ruby-prof-callstack-report.html', 'w') do |file|
  callstack_printer.print(file)
end

::Ci::DestroyPipelineService.new(project, user).execute(Ci::Pipeline.last)
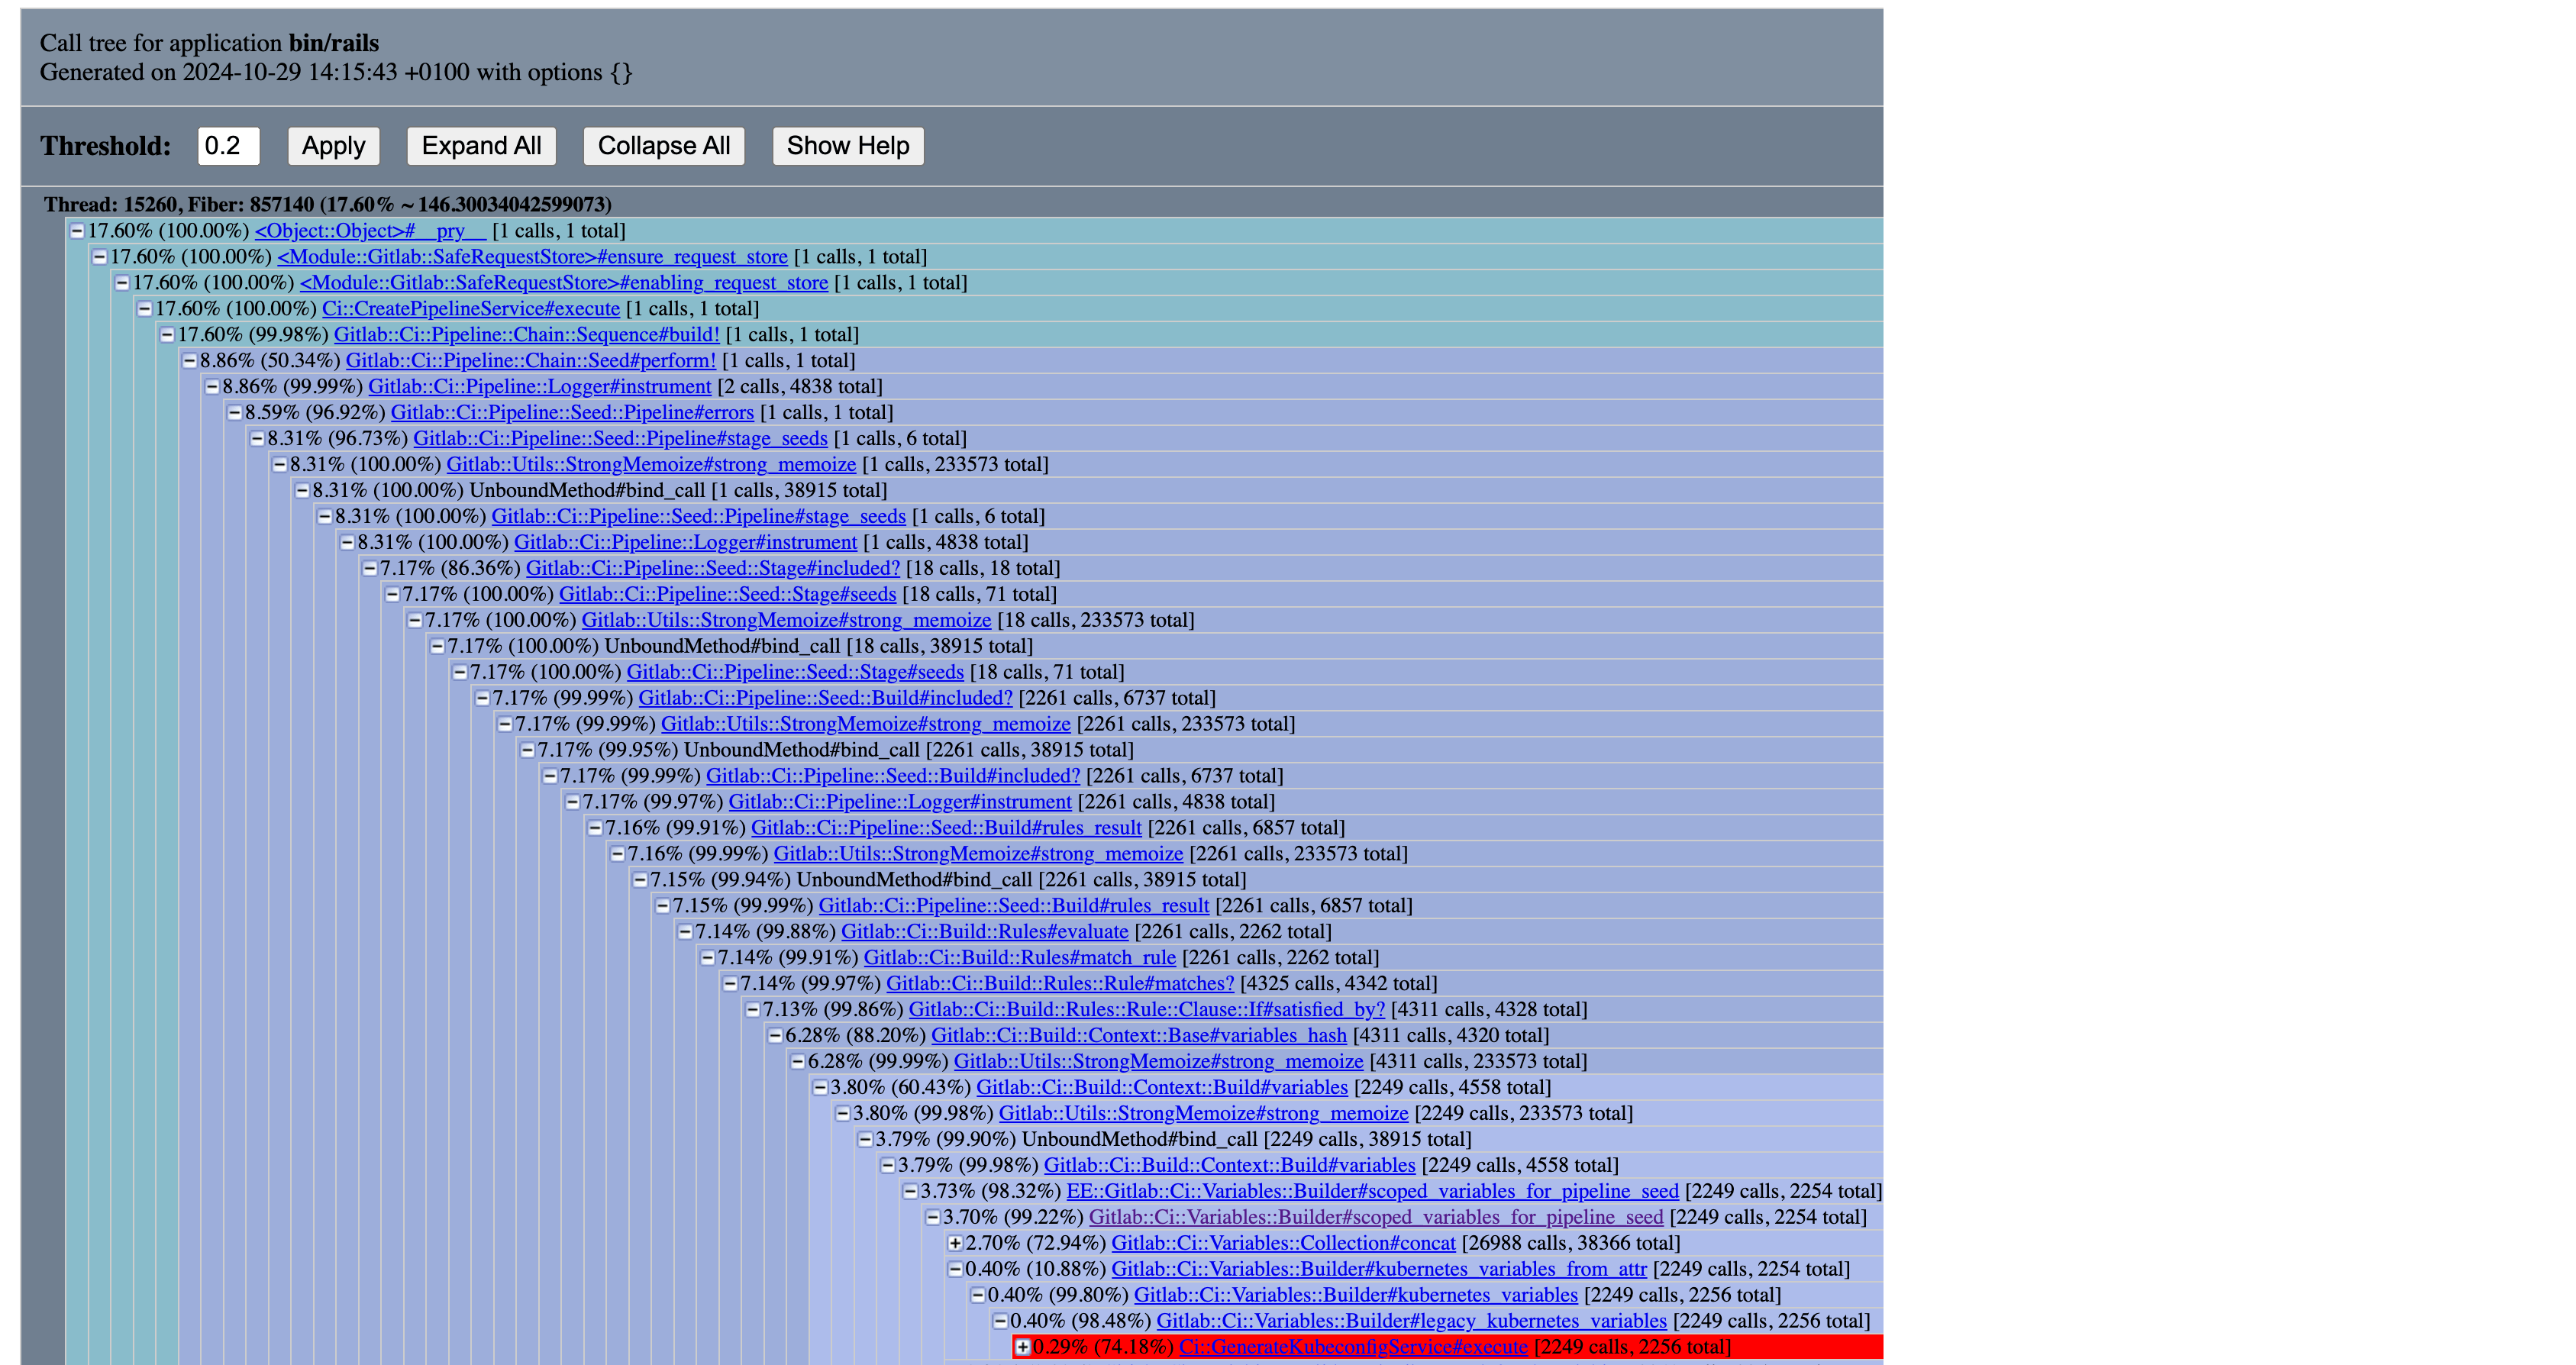
可见调用了 Ci::GenerateKubeconfigService 约 2k 次,这是需要重点优化的指标。
使用 memory_profiler
memory_profiler 是分析内存使用的工具。高内存消耗可能导致性能问题,因此同样重要。
与 stackprof 类似,也可使用 curl 并添加 performance_bar 参数:
curl "https://gitlab.com/api/v4/projects/:id/merge_requests/:iid/pipelines?performance_bar=memory" \
  -X POST \
  -o flamegraph.json \
  -H 'accept: application/json' \
  -H 'content-type: application/json' \
  -H 'cookie: xyz' \
  -H 'x-csrf-token: xyz'
但生产环境因 60 秒请求超时限制无法使用,需在开发环境获取内存分析。更多详情请参考 内存分析器文档。
# RAILS_PROFILE=true GITALY_DISABLE_REQUEST_LIMITS=true rails console

require 'memory_profiler'

ActiveRecord::Base.logger = nil
project = Project.find_by_full_path('root/gitlab-mirror')
user = project.first_owner
merge_request = project.merge_requests.find_by_iid(1)

# 预热
Ci::CreatePipelineService
  .new(project, user, ref: merge_request.source_branch)
  .execute(:merge_request_event, merge_request: merge_request); nil

report = MemoryProfiler.report do
  Gitlab::SafeRequestStore.ensure_request_store do
    Ci::CreatePipelineService
      .new(project, user, ref: merge_request.source_branch)
      .execute(:merge_request_event, merge_request: merge_request); nil
  end
end; nil

output = File.open('tmp/memory-profile-report.txt', 'w')
report.pretty_print(output, detailed_report: true, scale_bytes: true, normalize_paths: true)
结果:
#
# 注意:已省略与 gems 和 Rails 框架相关的部分。
#       为可读性,输出已精简。
#

总分配:1.30 GB (12974240 个对象)
总保留:29.67 MB (335085 个对象)

按 gem 分配的内存
-----------------------------------
 675.48 MB  gitlab/lib

...

按文件分配的内存
-----------------------------------
 253.68 MB  gitlab/lib/gitlab/ci/variables/collection/item.rb
 143.58 MB  gitlab/lib/gitlab/ci/variables/collection.rb
  51.66 MB  gitlab/lib/gitlab/config/entry/configurable.rb
  20.89 MB  gitlab/lib/gitlab/ci/pipeline/expression/lexeme/base.rb

...

按位置分配的内存
-----------------------------------
 107.12 MB  gitlab/lib/gitlab/ci/variables/collection/item.rb:64
  70.22 MB  gitlab/lib/gitlab/ci/variables/collection.rb:28
  57.66 MB  gitlab/lib/gitlab/ci/variables/collection.rb:82
  45.70 MB  gitlab/lib/gitlab/config/entry/configurable.rb:67
  42.35 MB  gitlab/lib/gitlab/ci/variables/collection/item.rb:17
  42.35 MB  gitlab/lib/gitlab/ci/variables/collection/item.rb:80
  41.32 MB  gitlab/lib/gitlab/ci/variables/collection/item.rb:76
  20.10 MB  gitlab/lib/gitlab/ci/variables/collection/item.rb:72

...
通过按文件和位置分配的内存,可定位内存优化点。在 近期工作 中,我们 找到了优化方案,得到以下结果:
#
# 注意:已省略与 gems 和 Rails 框架相关的部分。
#       为可读性,输出已精简。
#

总分配:1.08 GB (11171148 个对象)
总保留:29.67 MB (335082 个对象)

按 gem 分配的内存
-----------------------------------
 495.88 MB  gitlab/lib

...

按文件分配的内存
-----------------------------------
 112.44 MB  gitlab/lib/gitlab/ci/variables/collection.rb
 105.24 MB  gitlab/lib/gitlab/ci/variables/collection/item.rb
  51.66 MB  gitlab/lib/gitlab/config/entry/configurable.rb
  20.89 MB  gitlab/lib/gitlab/ci/pipeline/expression/lexeme/base.rb

...
此示例流水线总内存减少约 200 MB。